


 |
DESIGN LIGHTING DISTRIBUTION |
PHOTOMETRIC DISTRIBUTION
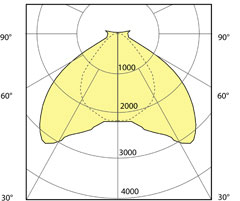
Polar Luminous Intensity Graph: The diagram illustrates the distribution of luminous intensity, in candelas, for the transverse (solid line) and axial (dashed line) planes of the luminaire. The curve shown provides a visual guide to the type of distribution expected from the luminaire e.g. wide, narrow, direct, indirect etc. in addition to intensity [1]. |
|
|
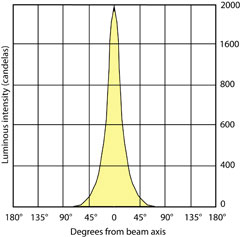
Cartesian Luminous Intensity Graph: The diagram indicates the distribution of luminous intensity, in candelas of the luminaire. The curve shown provides a visual guide to the type of distribution expected from the luminaire e.g. narrow or wide beam etc, in addition to intensity [3]. This diagram is useful when light intensity changes rapidly within a small angular area [4].
|
|
|
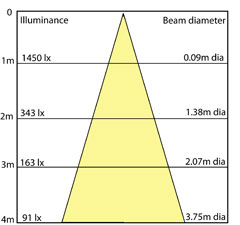
Illuminance Cone Diagram: Usually used for spotlights or lamps with reflectors, the diagram indicates the maximum illuminance at different distances away from the lamp [6]. |
|
aa |
EXAMPLES OF PHOTOMETRIC DISTRIBUTION IN MANUFACTURER'S LITERATURE:
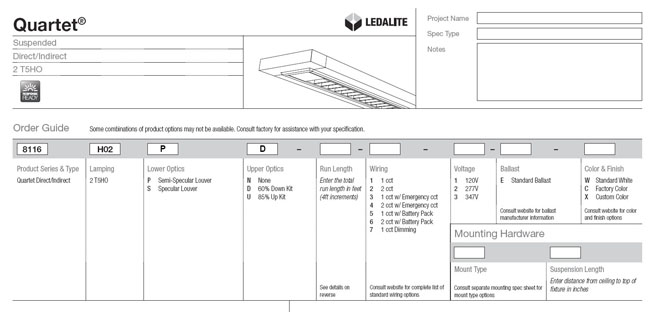
The cut sheet below shows the suspended Quartet luminaire with direct/ indirect 2 T5 High Output Fluorescent lamps. The voltage, finish and wiring options are included in the “order guide”.
In the figure below, the curve shown in the polar graph represents the candlepower distribution of the 1T5HO Quartet luminaire which indicates the luminous intensity (cd) in all directions from the center of the lamp. The lamp is located at the center; the lines radiating out from the center depict the angles and the concentric lines depict the decreasing luminous intensity.
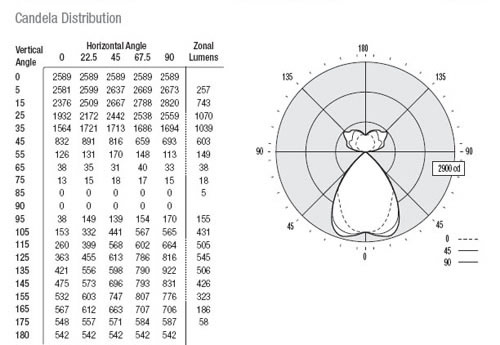
- The table next to the polar graph in Figure L-LD5 shows the values of the luminous intensity or candela distribution against the vertical and horizontal angles of the luminaire. For example, the luminous intensity at 0˚ horizontal angle and 45˚ vertical angle is 832cd.
- For luminaires with symmetrical light distributions, a single curve fully describes the luminaire’s distribution. Often only one side of the polar graph is shown, since the other side is an identical, mirror image. A luminaire with an asymmetrical distribution, such as a linear fluorescent downlight, requires curves in a number of planes to adequately represent its distribution. Typically, one curve is parallel to the luminaire and another is perpendicular to the luminaire; sometime either a third plane at 45° to three planes at 22 ½ ° intervals are added [10].
Some photometric distribution charts also have the spacing criteria mentioned on the cut sheet; see Figure L-LD6 below.
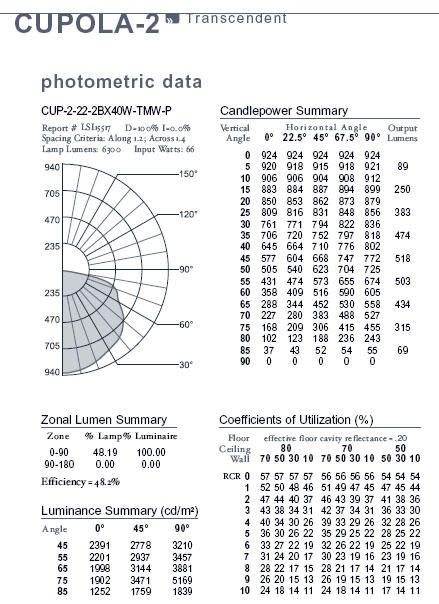
- The chart in Figure L-LD6 shows the spacing criteria along (parallel) and across (perpendicular) the length of the luminaire under the photometric data. The spacing criteria is used to estimate the distance between luminaires in a space as follows:
- Distance between luminaires= SC (spacing criteria) x MH (mounting height)
MH (mounting height) refers to the distance between the workplane and the bottom of the luminaire. Thus, if the bottom of the Cupola luminaire from the above example is mounted at a height of 8’ above the workplane in an interior space, the recommended spacing is 9.6’ based on the spacing criteria along or parallel to the luminaire being 1.2; and the recommended spacing across or perpendicular to the luminaires is 11.2’ based on a spacing criteria of 1.4. The spacing criteria indicates luminaire locations for spaces based on uniform illumination requirements [12]. - The zonal lumens summary table in Figure L-LD6 provides a quick overview of lumens in two zones. The table also indicates the overall efficiency of the luminaire and lamp combination [13].
References